
SERVICES
Delivery reporting and dashboards for restaurants
We track your DoorDash, Uber Eats and Grubhub sales, payout, reviews and errors every day, send short summaries every Monday, and walk you through a monthly report against goals we agree on at the start. It's for owners who don't have time to dig through three portals. You always know whether the month is on pace, and why.
WHAT'S INCLUDED
Every report we send, and what it's for
Reporting is part of every plan. You don't need to ask for it, and you don't need to log in anywhere to get it.
- Monthly goals, set at kickoffA sales goal for each month of the program, a payout ratio target and a review goal. We write them down before we change anything.
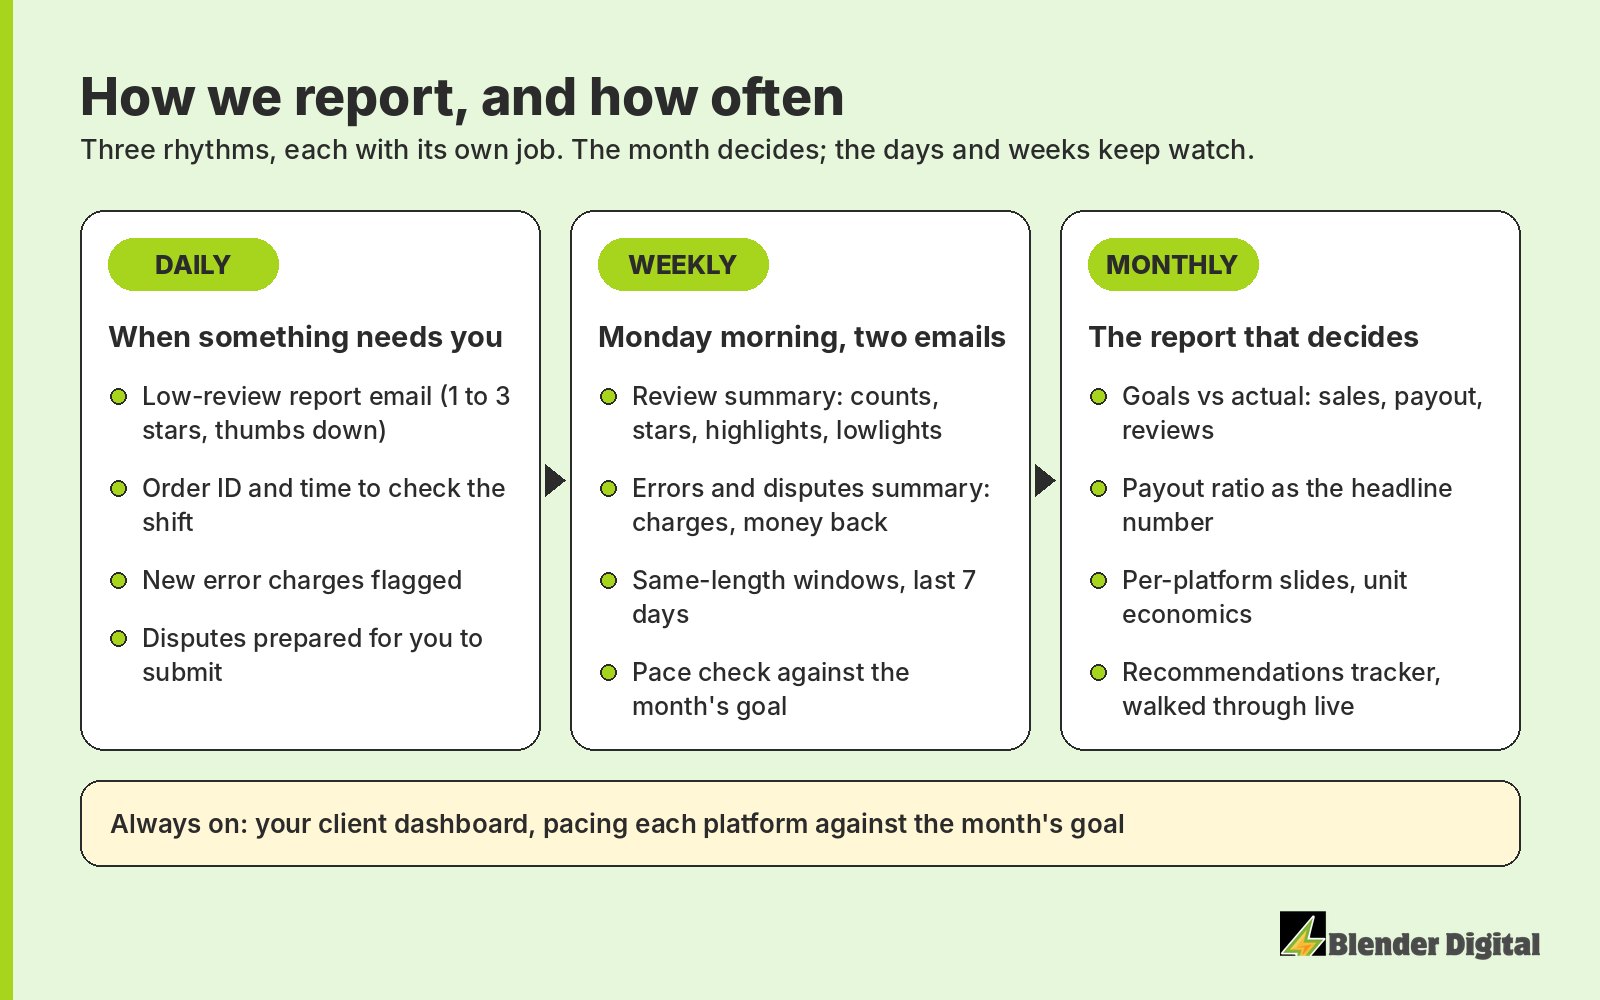
- Your client dashboardYour own login that shows each platform's sales and payout pacing against the month's goal.
- Daily low-review reportAn email the morning after a 1 to 3 star or thumbs-down review, with the order ID and time so you can check the shift.
- Daily error-charge flagsNew error charges reviewed every day, with disputes prepared for you to submit where the evidence supports it.
- Monday review summaryLast week's reviews by platform, the star breakdown, highlights and lowlights, and offers redeemed.
- Monday errors and disputes summaryA separate email: charges, what was disputed, what came back, and what's still pending.
- Monthly report, walked through liveGoals against actuals, per-platform results, unit economics, reviews, errors and next month's plan.
- A recommendations trackerEvery recommendation with an owner and a status, so nothing we agree on gets lost between calls.
THE REPORTING RHYTHM
How often do you report, and what does each report cover?
Three rhythms, each with one job. Daily emails only show up when something needs your attention. Monday summaries keep watch. The monthly report is where we make decisions.
THE NUMBER WE LEAD WITH
Why is payout ratio the headline, not sales?
Payout ratio is your net payout divided by your gross sales. It's the share of each dollar that actually reaches your bank after commission, promotions, ads, redemption fees and refunds.
Say a store sells $10,000 on Uber Eats in a month and gets $5,300 deposited. That's a 53% payout ratio, or 53 cents on the dollar. If the next month sells $11,000 but only pays out $5,000, sales went up and you took home less.
"The most important number when you're selling on third party is a singular number, which is payout ratio."
Hassan Shaikh, founder
For context: with no promotions at all, you can't do better than about 70 to 85 cents on the dollar, because that's what's left after commission. In a growth phase with heavy offers, around 50 cents is respectable and 60 is good. We put growth percentage at the top of the report with the raw dollars next to it, and payout ratio right beside both. More on this in how much delivery revenue restaurants actually keep.
HOW WE DO IT
Baseline first, then a month you can actually read
Good reporting starts before the first campaign goes live. If the starting point isn't written down, every number after it is a guess.
Write down the baseline and the goals
We pull your current sales, payout and reviews by platform, agree on how aggressive you want to be, and set a month-by-month ramp. "If we're not measuring against something tangible, we're setting ourselves up for failure."
Start clean, on the 1st
Programs start on the first of the month so every report covers a full calendar month. In month one we change as little as we can outside the plan, so the results are readable.
Watch daily, judge monthly
We check every day, but we don't react to one bad Tuesday. Algorithms swing day to day, and individual orders can pay out anywhere from 20 to 80 cents on the dollar. Over a month, they meet in the middle.
Walk through it, then decide
Each month we walk you through the report live, show what moved and why, and write next month's recommendations for your approval. Once growth goals are met, we shift the focus to keeping more of each dollar.
WHAT WE TRACK
The numbers in every report
Payout ratio leads. The rest explains why it moved.
Sales against goal
Month to date, by platform, and whether you're on pace for the month's target.
Payout and payout ratio
What actually got deposited, and the cents on the dollar it works out to.
Orders and average order value
Growth split into more orders versus bigger tickets, because each one calls for a different move.
Payout per order vs in-store ticket
Platform average order times payout ratio, set against what a walk-in spends. It shows how much less profitable the channel is.
Campaign and ad returns
Sales per dollar on ads and offers, read on each platform's own scale. DoorDash and Uber Eats calculate it differently.
Reviews
Review count, review rate, star mix and review offers redeemed, against the month's review goal.
Errors and disputes
Error rate, dollars charged, dollars recovered and disputes still pending.
Online share of store sales
Third-party sales as a share of total store sales, so you can see what delivery means for the whole business.
Return on our fee
What the channel earned you compared with what you pay us, with any margin assumption spelled out.
TIME WINDOWS
Why don't you trust the platform's "vs last week" numbers?
Because they can be wrong, and when they're right they're often misleading. We've seen a DoorDash "vs 7 days prior" comparison show growth of 11,000%. A store that launched mid-month will always look like a rocket ship against a half month.
So we follow a few simple rules. Compare full calendar months. When we compare weeks, both windows are the same length and we say which dates they cover. Never compare numbers from two different sources or two different windows to make a headline. And note the quirks: Uber Eats closes its payout week late Sunday night, so its weekly totals won't match your POS.
"Week to week it may not tell the full story, but by the end of the month it will."
Hassan Shaikh, founder
For a plain-English guide to the numbers the apps show you, see DoorDash and Uber Eats metrics explained.
WHAT IT LOOKS LIKE IN PRACTICE
Goals we set, and how the months went
ONE PLAN
One report for the whole channel, from the team running it
Most owners piece the picture together from three platform dashboards, a POS report and a spreadsheet. If you also pay a review tool or a dispute service, each one reports on its own slice. Our reports come from the same people running your campaigns, so every number comes with the next move.
Piecing it together
- Three portals, each with its own definitions and comparison windows
- A review tool's report covers reviews, a dispute service's covers recoveries
- Nobody ties sales, payout, reviews and errors to one monthly goal
- The numbers tell you what happened, not what to change
One Blender Digital plan
- Sales, payout, reviews, errors and campaigns in one monthly report
- Every platform measured against goals we agreed on at the start
- Recommendations come from the people making the changes
- Included in every plan, starting at $1,030 a month on a 6-month program
FAQ
Questions about our reporting
What is in the monthly delivery report?
Goals against actuals for sales, payout and reviews, then an executive summary: sales, orders, average order value, payout and payout ratio. After that come per-platform pages, unit economics, reviews, errors and disputes, and a recommendations tracker that shows who owns each item and where it stands.
We walk you through it live, and send a short text summary too, because most owners won't read a full deck on their phone.
How often will I hear from you?
Daily only when something needs you: a low review or a new error charge. Every Monday you get two short emails, one on reviews and one on errors and disputes. Once a month you get the full report and a call. Your dashboard is there any time in between.
Why do you report payout ratio instead of just sales?
Because sales don't pay your bills, payouts do. Payout ratio is net payout divided by gross sales, so it shows how many cents of each dollar actually reach your bank after commission, promos, ads and refunds. A month with more sales and a lower payout ratio can leave you with less money.
Do you guarantee we will hit the monthly goals?
No. Nobody serious can promise an outcome on platforms whose algorithms change daily. The goals are what we measure ourselves against, and the report shows the miss as clearly as the hit, with the reason and what we're changing next month.
Can I see my numbers between reports?
Yes. Clients get a login to a dashboard that paces each platform against the month's goal, so you can check where the month stands without opening three different portals.
Want to know where your delivery month is really headed?
Book a free 30-minute call. We'll look at your current setup across the apps, tell you what your payout ratio is likely telling you, and what we'd track first.